Miscellaneous
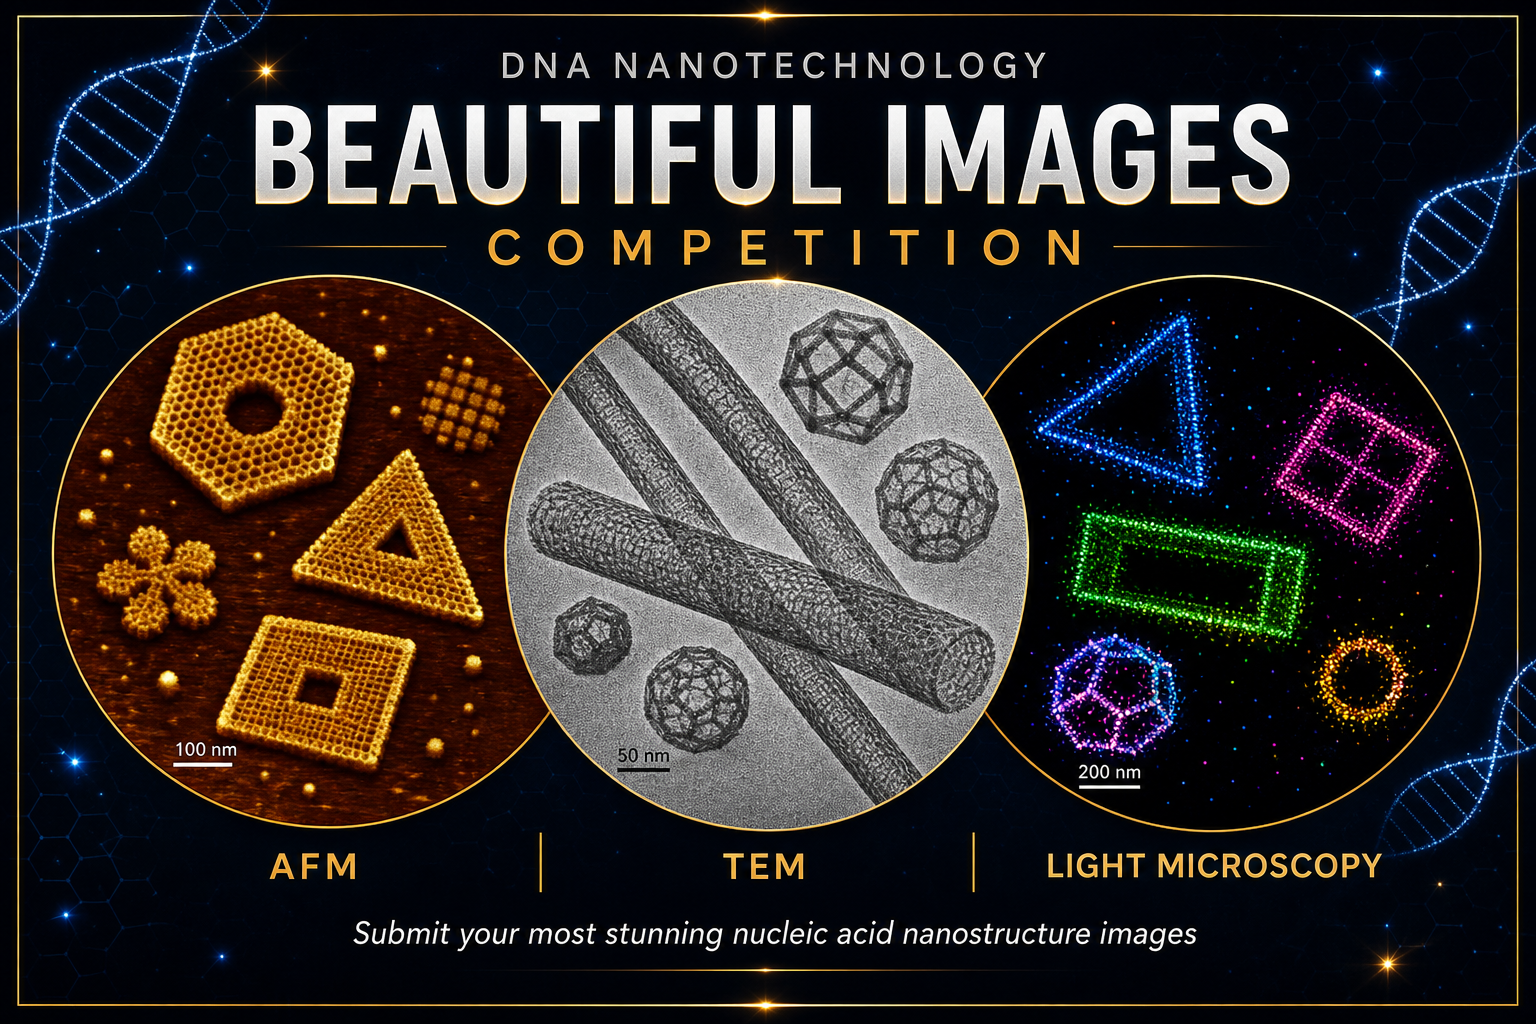
Beautiful Images Competition
- Category 1: AFM
- Category 2: TEM
- Category 3: Light microscopy (PAINT) and others
Inspiration: https://www.nikonsmallworld.com/
How Challenges Operate
Once a year we will solicit anyone in the DNA nanotechnology community to submit either (1) atomic force microscopy (AFM), (2) electron microscopy (EM), or (3) light microscopy (super-resolution) images of nucleic acid nanostructures.
How it will be scored
A panel of 5 independent judges consisting of graduate students, professors, postdocs, scientists, science communicators, or similar will judge the entries. Entries will be judged based on the following criteria:
- Technical merit — how well the entrant has utilized the instrument to achieve the best possible image.
- Information content — how informative the image is.
- Beautiful appearance — how visually stunning the image is.
- Novelty — how unique and original the image is.
For each criteria, judges will rate an image on a scale of 0–10 with 10 being the highest and 0 being the lowest. By summing the score for each criteria, an image will have a score between 0 and 40 for each judge, 40 being the highest and 0 being the lowest. The image’s final score will be the average of all the judges’ scores. In the case of a tie, judges will consider each image head to head with each judge deciding between the two images which they believe is most deserving of the award based on the 4 categories.
Examples
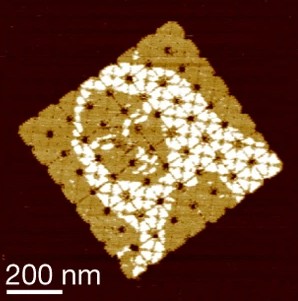

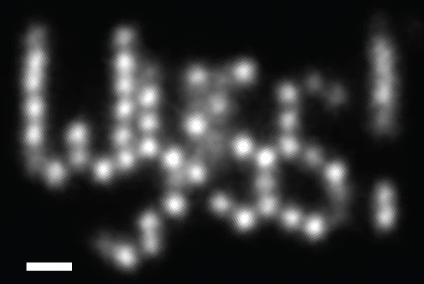
AFM images from Tikhomirov et al. Nature 2017. Averaged TEM image from Ong et al. Nature 2017. DNA-PAINT image from Schnitzbauer et al. Nature Protocols 2017.
Reward structure
Many potential reward structures exist. Ordered by greatest incentive for entry, examples include:
- Financial Reward — Organizers can seek partnership with leading companies like Bruker for AFM, Thermo Fisher for EM, and Nikon for light microscopy. Companies could agree to provide financial support in return for the publicity. Alternatively, financial awards could be supplied from a grant.
- Journal or Conference Publication — Partnership could be sought with ACS Nano, Journal of Nanotechnology, Nature Nanotechnology, or other nanotechnology-focused journals to publish a short article consisting of the top images from the year of nucleic acid nanotechnology. Alternatively, images could be displayed at top nanotechnology conferences (DNA or FNANO) and entrants could be invited to share their work at the conference.
- Publicity / recognition — Display of winning images can be done on a public platform like X, Bluesky or LinkedIn with the winning entrants tagged. This provides a free way to reward winners by helping to grow their network.
Design Challenges
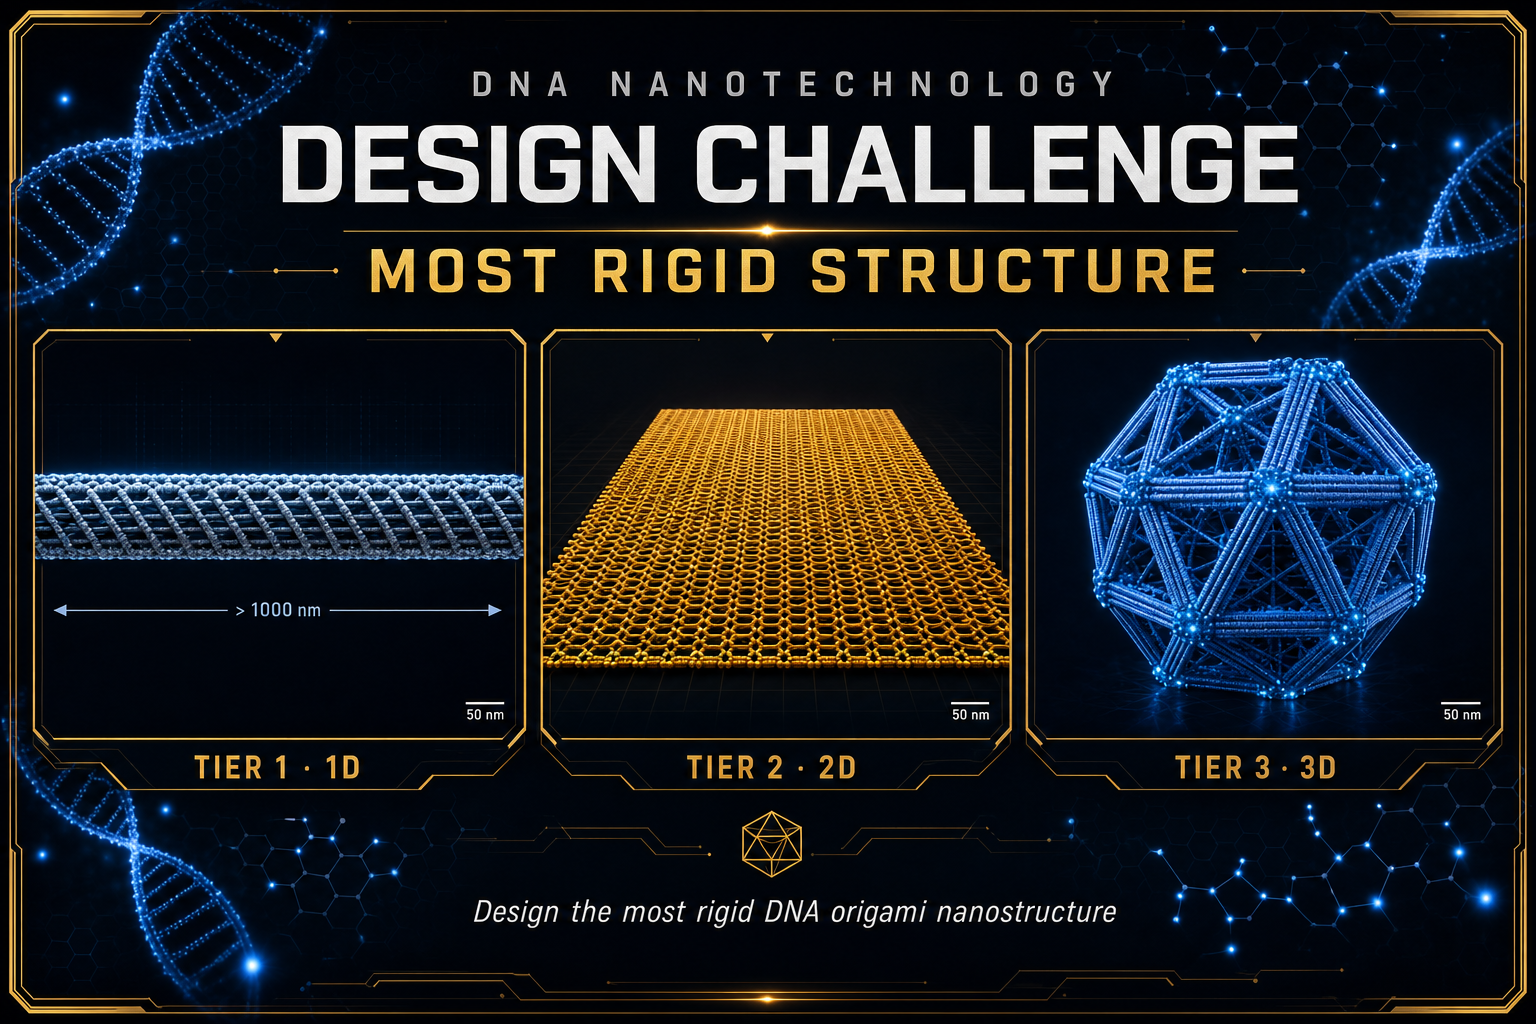
Most rigid structure
- Tier 1: 1D — Design a DNA origami with the greatest length and rigidity in one dimension that can be synthesized with high yield.
- Tier 2: 2D — Design a DNA nanostructure with greatest surface area (2D) and least fluctuations that can be synthesized with high yield.
- Tier 3: 3D — Design the 3D DNA origami with the greatest addressable surface area with the least structural fluctuations that can be synthesized with high yield.
How Challenges Operate
For each challenge, Tier 1 will be introduced first. Each challenge will be live for 3 months (subject to change) during which time entrants can submit up to 3 designs each. Submissions will be limited to those utilizing the M13MP18 scaffold. Designs can be submitted as oxDNA .top and .dat files or other common file formats compatible with conversion to oxDNA (ScadNano, CadNano, etc.).
Screening
All designs received will initially be screened for merit using oxDNA. From the screening, the top 3 designs will be chosen to be experimentally compared. Each tier will have different criteria for screening:
- 1D Criteria — oxDNA will be used to measure the persistence length of each entry and the overall length of each origami. A score will be assigned for each origami corresponding to the persistence length in nanometers + the average measured length, thus equally weighting rigidity and length.
- 2D Criteria — oxDNA will be used to measure the surface area of the 2D origami and also the structural fluctuations. Structural fluctuation will be measured as the average root-mean-square fluctuations of all nucleotides.
- 3D Criteria — oxDNA will be used to measure the addressable surface area of the 3D origami and also the structural fluctuations. Addressable surface area is defined as a region with double-stranded DNA. Structural fluctuation will be measured as the average root-mean-square fluctuations of all nucleotides.
Experimental Validation
The top three designs for each tier will be evaluated as follows. Firstly, annealing will be tested with 3 different MgCl concentrations (5 mM, 12.5 mM, and 20 mM). Three annealing protocols will be tested with linear temperature ramps from 60 °C to 20 °C over 2 hours, 8 hours, and 16 hours. Staples will be added in 10× excess of the scaffold for all samples. In total, for each design 9 different samples will be generated (3 annealing protocols × 3 MgCl concentrations). The yield of each origami sample will be evaluated using gel band intensity. From each design, the synthesis protocol achieving the highest yield will be selected for evaluation of challenge performance. Challenge performance will be evaluated as follows:
- 1D Experimental Validation — Samples will all be deposited onto mica under identical buffer conditions and preparation conditions. For each sample, enough 5×5 µm images will be captured to image at least 50 origami total. The length and persistence length of each origami will then be evaluated from the AFM images. Average length and average persistence length will be determined for each design. This value will then be multiplied by the origami yield as determined by gel. This metric
[(Lp + L) × %yield]will be used to determine the challenge winner. - 2D Experimental Validation — We will use DNA-PAINT to determine sample rigidity. Samples will all be deposited onto glass coverslips using biotin–streptavidin immobilization under identical buffer conditions and preparation conditions. For each sample, the origami undergoing testing will be co-incubated with a control sample to determine how much variance is from imaging conditions versus sample conformational flexibility. For each sample, enough images will be captured to obtain 100 DNA origami samples and 100 control samples. Pairwise distances will be calculated between each DNA docking site. The average absolute magnitude of the measured distance subtracted by the expected distance from DNA geometry alone will serve as the metric of flexibility. This value will then be multiplied by the origami yield as determined by gel. This metric
[Flexibility × %yield]will be used to determine the challenge winner.
If available, structures will be characterized using CryoEM instead of DNA-PAINT.
- 3D Experimental Validation — Samples will all be deposited onto carbon-coated TEM grids under identical buffer conditions and preparation conditions. For each sample, the origami will be stained with Uranyl Acetate. For each sample, enough images will be captured to obtain 500 DNA origami samples. Structural averaging will then be performed and the experimental structure will be compared to the simulation-predicted structure. In addition, the per-pixel variance will report on the structural heterogeneity. The average per-pixel variance will be computed, and the percent difference of each origami dimension compared to the expected from DNA geometry will also be calculated. These values will then be multiplied by the origami yield as determined by gel. This metric
[%Variance × %Discrepancy × %yield]will be used to determine the challenge winner.
If available, the structure will be characterized using CryoEM instead of TEM.
Reward structure
Many potential reward structures exist. Ordered by greatest incentive for entry, examples include:
- Financial Reward — Organizers can offer financial awards supplied from a grant to be paid out to the contest winner.
- Position within the lab — The winner may be offered a temporary internship position within the organizing lab. During this time, the winner is expected to work with their designed origami to realize a practical application.
- Publication — The winner can be guaranteed authorship on a conference abstract or journal article including their origami.
- Publicity / recognition— The winner’s design and corresponding images (AFM / DNA-PAINT / TEM) can be published on Bluesky or LinkedIn with the winning entrants tagged. This provides a free way to reward winners by helping to grow their network.
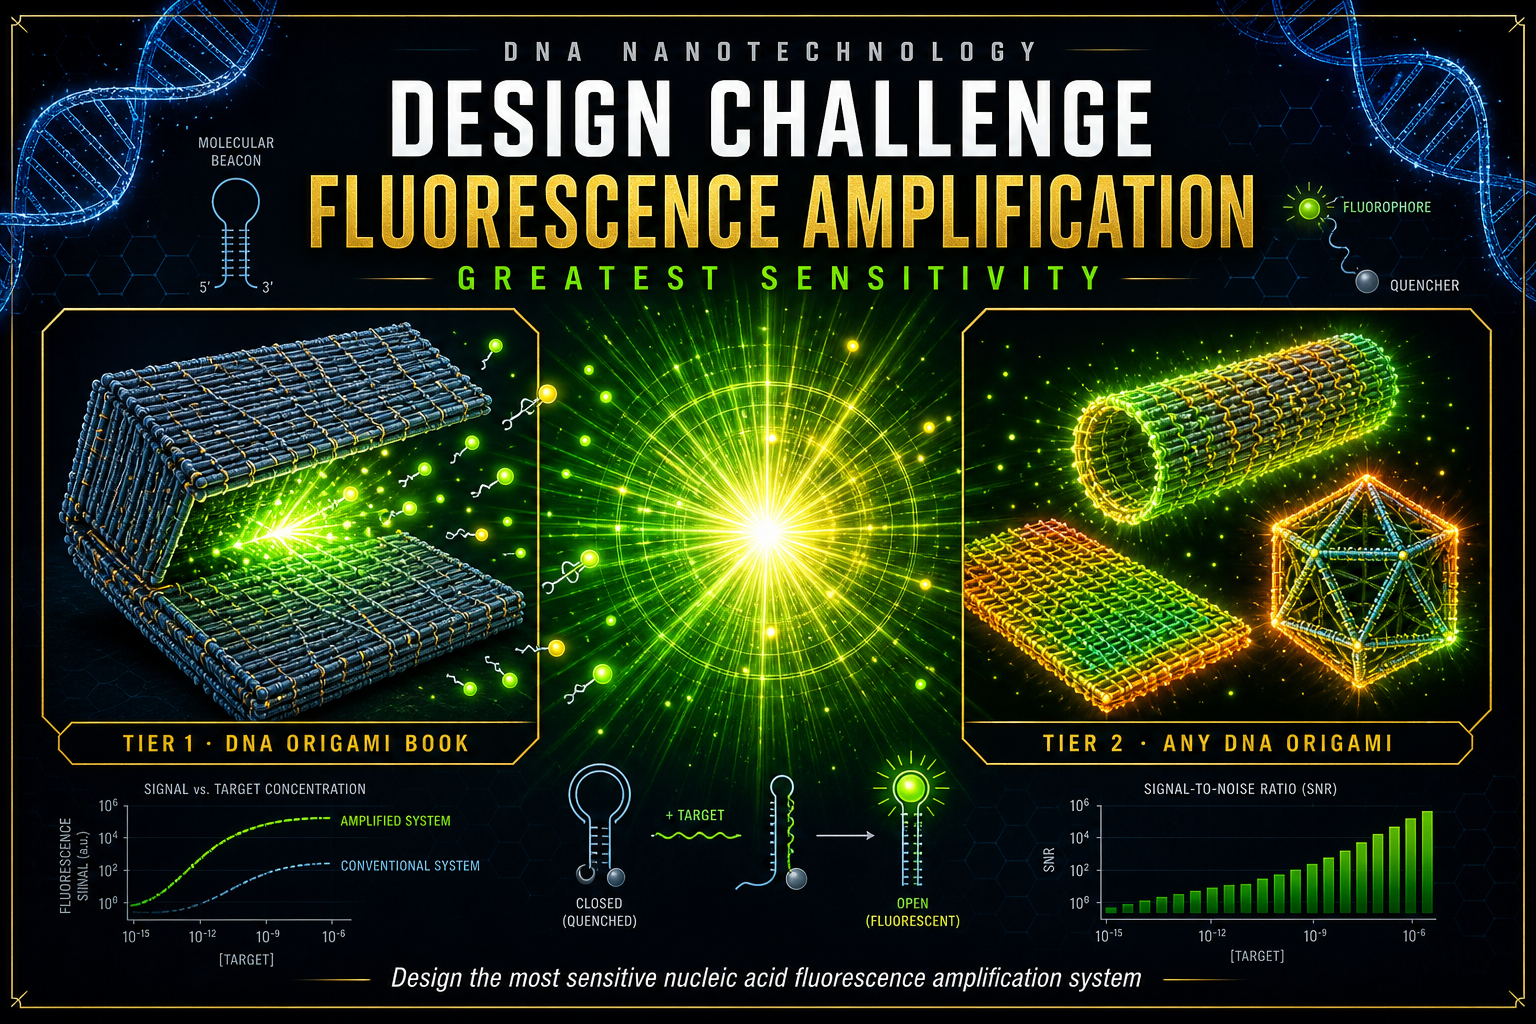
Fluorescence amplification with greatest sensitivity
- Tier 1: Using DNA origami Book
- Bond arrangement
- Bond Sequence
- Tier 2: Any DNA Origami nanostructure.
How Challenges Operate
Tier 1:Participants will be given a grid of 8×6 corresponding to the extensions on a single page of the DNA origami book. Participants will submit a 2D array in the shape of 8×6 with either 0, 1, 2, or 3 in each position. 0 means no bond, 1 means weakest bond, 2 means moderately strong bond, 3 means strongest bond. Bond sequences will be made available to participants at the time of the competition. Participants can submit up to 3 submissions each. The DNA origami will be made to be responsive to a single 20 nt oligo sequence. The DNA origami book is a 16HB rectangular 2D origami nanostructure. The two ‘pages’ of the book are separated using flexible ssDNA linkers between all 16 helices. On each page of the book are 48 sites which can contain extension sequences. The 48 sites were arranged such that protruding DNA extensions would face towards the extension on the other book. In this manner, complementary sequences on each face would cause the book to ‘close’ with both ‘pages’ bound together.
Example submission
Seq 1 = AGCTASeq 2 = GCATCCASeq 3 = AGCGTAGGA
| 1 | 0 | 0 | 0 | 0 | 0 | 0 | 0 |
| 0 | 0 | 0 | 0 | 2 | 0 | 0 | 3 |
| 0 | 0 | 2 | 0 | 0 | 0 | 3 | 0 |
| 0 | 0 | 0 | 0 | 3 | 0 | 0 | 0 |
| 0 | 2 | 0 | 0 | 0 | 0 | 0 | 0 |
| 0 | 1 | 0 | 0 | 0 | 3 | 0 | 0 |
0 no bond1 weakest2 moderate3 strongest
Tier 2: Submissions will be limited to those utilizing the M13mp18 scaffold. Designs can be submitted as oxDNA .top and .dat files or other common file formats compatible with conversion to oxDNA (ScadNano, CadNano, etc.). Participants can submit up to 3 submissions each. The DNA origami will be made to be responsive to a single 20 nt oligo sequence.
Screening
All designs received will initially be screened for merit using oxDNA. From the screening, the top 3 designs will be chosen to be experimentally compared. Each tier will have different criteria for screening:
- Tier 1: Designs will be input to oxDNA and Metadynamics will be used to sample conformational states of both low and high free energy. The effect of the target strand addition will be analytically accounted for using the WLC approximation. To rank submissions, we will calculate the distance between the center of mass of each DNA origami page in the average structure of the origami with and without the target strand.
- Tier 2: Designs will be input to oxDNA and Metadynamics will be used to sample conformational states of both low and high free energy. The effect of the target strand addition will be analytically accounted for using the WLC approximation. To rank submissions, we will calculate the distance between 8 extension sites in the average structure of the origami with and without the target strand.
Experimental Validation
The top three designs for each tier will be evaluated as follows.
- Tier 1: The DNA origami designs will be synthesized in identical buffer conditions and purified using ultracentrifugation with 100 kDa filters. For each sample, 3 conditions will be run with three replicates each: (1) sample with target added in plate reader, (2) sample without target, (3) sample with target pre-added. The signal-to-noise ratio of the fluorescence assay will be the performance metric, the ratio will be defined as the percent change between sample 1 and sample 2. The highest scoring design will be the winner.
- Tier 2: The top three designs will be evaluated as follows. Firstly, annealing will be tested with 3 different MgCl concentrations (5 mM, 12.5 mM, and 20 mM). Three annealing protocols will be tested with linear temperature ramps from 60 °C to 20 °C over 2 hours, 8 hours, and 16 hours. Staples will be added in 10× excess of the scaffold for all samples. In total, for each design 9 different samples will be generated (3 annealing protocols × 3 MgCl concentrations). The yield of each origami sample will be evaluated using gel band intensity. From each design, the synthesis protocol achieving the highest yield will be selected for evaluation of challenge performance. For each sample, 3 conditions will be run with three replicates each: (1) sample with target added in plate reader, (2) sample without target, (3) sample with target pre-added. The signal-to-noise ratio of the fluorescence assay will be the performance metric, the ratio will be defined as the percent change between sample 1 and sample 2. This value will then be multiplied by the origami yield as determined by gel. The highest scoring design will be the winner.
Reward structure
All design challenges will use the same reward structure.
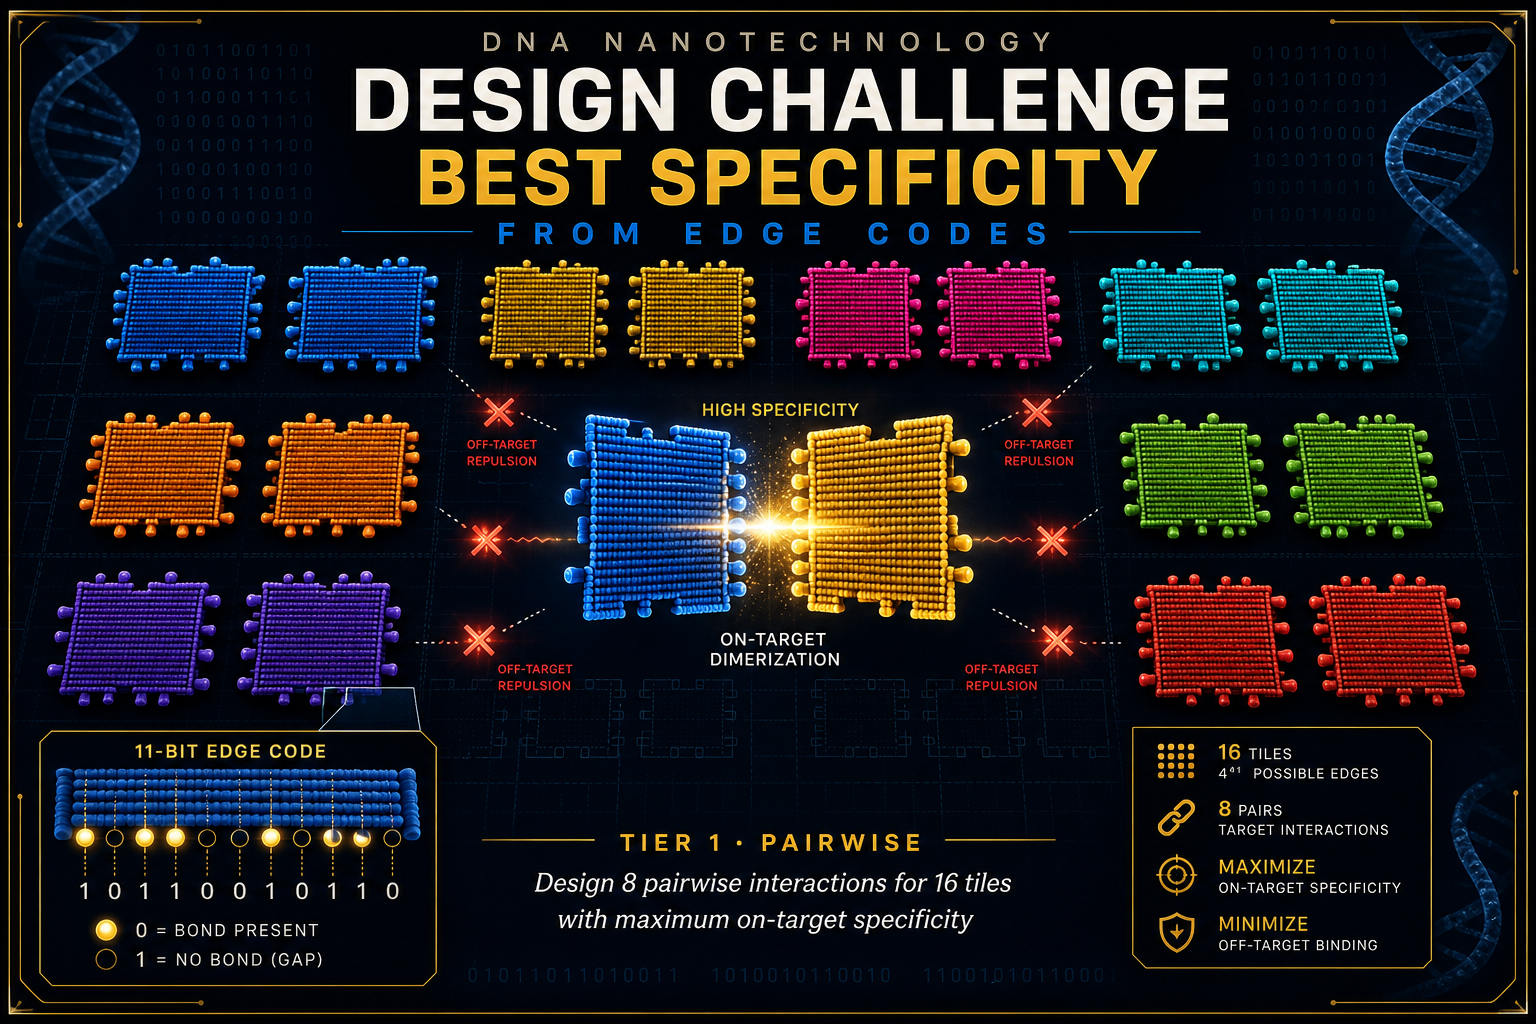
Best specificity from edge codes
- Tier 1: Pairwise
How Challenges Operate
Tier 1: Participants will fill in 8 one-dimensional arrays of 11 bits (0 or 1) where 0 is the presence of a bond and 1 is the absence of a bond. This will correspond to a DNA origami tile edge where the sequences are provided to the participants ahead of the competition. The objective of the challenge is to design 8 pairwise interactions so that 16 DNA origami tiles can be mixed together and only the 8 desired dimerizations will occur. Participants will be trying to maximize on-target dimerization and minimize off-target interactions. Participants can submit up to 3 submissions each.
Screening
All designs received will initially be screened for merit using oxDNA and a custom-built analysis pipeline. From the screening, the top 3 designs will be chosen to be experimentally compared.
- Tier 1: Stabilities of each dimer will be estimated using the sum of the Gibbs free energy of association for all extensions included in the design. This will then be compared to the off-target energies of association between unwanted dimers. Off-target association energies will be calculated by pooling all extension sequences included for two tiles and estimating the sum of the Gibbs free energy using NUPACK. The design with the overall greatest differential (on-target stability − Maximum(off-target stability)) for all 8 pairs will be the highest scoring design. oxDNA can also be used by estimating the melting temperature of the on-target and off-target reactions. Designs with the greatest difference in on-target melting temperature compared to off-target will be the highest scoring design.
Experimental Validation
The Tikhomirov lab will synthesize the 16 tiles for each winning design. Tiles will all be synthesized in separate tubes under identical annealing and buffer conditions. After annealing, negation strands will be added to all tubes under identical conditions. Next, all 16 tiles will be mixed together in an equimolar ratio without any annealing. Each of the tiles will have a unique combination of extensions protruding from the face of the tile so that they will be distinguishable via AFM or DNA-PAINT. For each design, ten 5×5 µm images will be obtained using AFM. The yield of each dimerization reaction will be scored as # dimers / (# Monomer A + # Monomer B). The average yield of the 8 reactions will be obtained. Off-target interactions will be penalized as follows: (1 − # off-target dimers / # total dimers). The mean of these two averages will be the final score. The highest scoring design will be the winner.
Coding Challenges
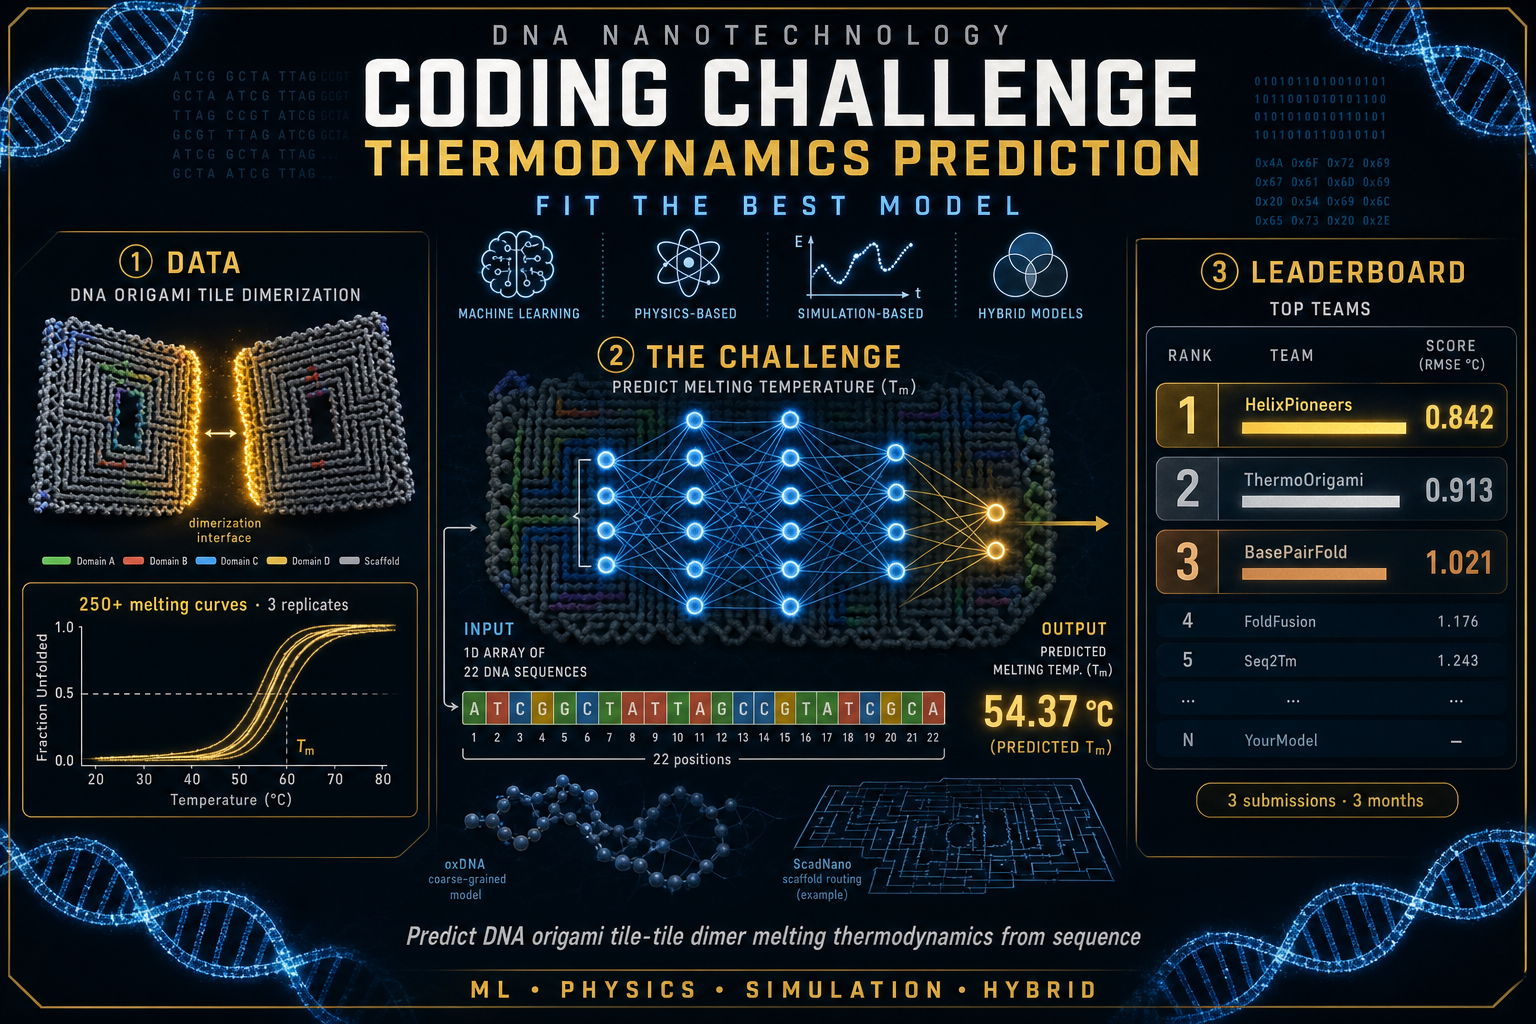
Fitting a better model to thermodynamics dataset
How Challenges Operate
For this challenge, participants will be provided access to the publicly available data from Tikhomirov lab detailing over 250 melting curves from DNA tile–tile dimers. Specifically, participants will have access to (1) ScadNano and oxDNA files, (2) all DNA sequences, (3) raw data from three replicates of melting curve per origami interface. Participants can then develop any predictive platform they desire. Examples include (1) ML-based, (2) physics-based, (3) simulation-based, (4) hybrid methods. Users will have 3 months to make submissions and are allowed up to 3 submissions each. As input, each predictive model should take a 1D array of 22 DNA sequences.
Experimental Validation
While participants are building models, the Tikhomirov lab will experimentally determine the melting temperature of 50 new multivalent interfaces. This data will be used as a testing set for the submitted models. All submitted models will have their performance tested by asking the model to predict the melting temperature of these novel interfaces. They will be scored by the root-mean-square error of their predictions versus the experimental data. The model with the least error is the best performing model.
Reward structure
Reward structure is identical to the rigidity design challenges.